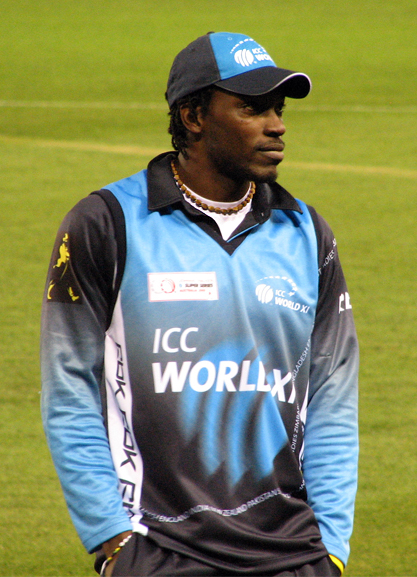
Showing posts with label Chris Gayle. Show all posts

Tuesday, 9 June 2020

A brief look at test openers

I saw an interesting discussion online about who was a better test opener, Chris Gayle or Virender Sehwag. 

I really rate Gayle as a test player, but there's no doubt that Sehwag's raw numbers are better. But I wondered how much of that was down to him playing most of his cricket in India, which is custom made for his style of opening batting.

I thought that an interesting way to compare them would be to look at how much better each of them was at getting a start and going on after getting their start when compared to other players that they played with and against.

Comparing them with others in the same match is not without it's flaws, but it does allow the pitch conditions etc to be taken into account.

Monday, 16 December 2013

Warner in Perth

I have written before about how impressed I am with David Warner's running between wickets. I genuinely believe that he is one of the best at judging a run that I've seen.

Accordingly I was surprised to see that he had scored the same number of singles as boundaries in the second innings at Perth. I also heard the commentators describe it as a typical innings from Warner. It made me wonder if it actually was a typical innings.

First of all I looked at how Warner compared to other batsmen.  The method I chose to look at was to compare the boundary percentage (boundaries per delivery) and the activity rate (runs scored per non-boundary delivery). I filtered out any batsman who hadn't faced more than 650 deliveries since 2000, hadn't hit more than 50 fours and hadn't played in the past 2 years. I then put the rest of the batsmen on a single graph.

I divided up the batsmen into 4 categories. Aggressive, Block Bash, Pushers and Defensive. Close to the extremes of each group were players who have been reasonably successful.

In the defensive group are players like Rahul Dravid, Peter Fulton, Tino Mawoyo, Ed Cowan and JP Duminy.
Block Bash contains Angelo Mathews, Shane Watson, Chris Gayle and Yuvraj Singh.
Pushers includes Kane Williamson, Shiv Chanderpaul, Jonathan Trott and Thilan Samaraweera.
Aggressive include Ricky Ponting, Sachin Tendulkar, Darren Sammy and David Warner.

Warner has a higher activity rate than anyone in the list. But he also hits more boundaries than most batsmen.


Warner's activity rate for his career is 0.353 and his boundary rate is 9.3%. His innings in Perth lasted 140 deliveries. We would expect 13 boundaries, perhaps 12 fours and 1 six. Off the other 127 deliveries we would expect him to score 45 runs. Overall we would expect that he would be on about 99, rather than 112, so he scored slightly faster than we would expect, but the big difference was the make up of the innings.

Warner scored 80 runs in boundaries. That's about 40% more than we would normally expect him to get.

I used the same graph as above, to analyse Warner's other innings. I've included every innings where Warner has scored more than 30. I've drawn in lines to show which group the innings would have fit in.
We can see that Warner's innings does fit in with some of his other innings, but really is closer to the Block Bash quadrant than almost any of his other innings.

It was an interesting innings, because of the context and the opponent, but also because of the way that he scored the runs.

Thursday, 25 April 2013

How good was Gayle's demolition of Pune

Chris Gayle, picture from RCB's Flickr stream
Chris Gayle played one of the most incredible innings on Tuesday night. His 175* (66) broke all sorts of records, both for the IPL and for t20 and cricket in general.

He is without question an incredible player, and is an absolute phenomenon in the IPL.

But how good was that innings in the context of the rest of the IPL? I heard some people say that it was meaningless, because the pitches and grounds in India are so easy to score runs on, and the bowlers in the IPL aren't up to much. I heartily disagree with both of these statements, but the only real way to look at the innings is to look at how others have gone in similar conditions.

To do this I'm using my modified batting index for each innings. This system rewards scoring runs, and being not out, but adjusts it for the number of deliveries faced. To put these scores in context an index of 100 would be 70*(49) or 60(33). It doesn't take into account the context of the match, so there can be some high scores that cost a team, and low ones that win a match, but I think it's better than just looking at the runs scored or the strike rate by themselves.

Here's the top 20 innings in the IPL so far this year:

NameScoreForAgainstAtIndex
CH Gayle 175* (66)RCB Warriors Bangalore 464.02
V Kohli 93* (47)RCB Sunrisers Bangalore 184.02
SR Watson 101 (61)Royals Super Kings Chennai 158.95
V Sehwag 95* (57)Daredevils Mum Indians Delhi 158.33
DA Miller 80* (41)Kings XI Warriors Mohali 156.1
CH Gayle 92* (58)RCB Mum Indians Bangalore 145.93
KD Karthik 86 (48)Mum Indians Daredevils Mumbai 145.13
CH Gayle 85* (50)RCB KKR Bangalore 144.5
MEK Hussey 88 (51)Super Kings Royals Chennai 143.22
MEK Hussey 86* (54)Super Kings Kings XI Mohali 136.96
RG Sharma 62* (32)Mum Indians Warriors Mumbai 120.13
AB de Villiers 64 (32)RCB Super Kings Chennai 118
RG Sharma 73 (43)Mum Indians Daredevils Delhi 115.44
RG Sharma 74* (50)Mum Indians Daredevils Mumbai 109.52
Mandeep Singh 77* (58)Kings XI Warriors Mohali 102.22
AB de Villiers 31 (8)RCB Warriors Bangalore 100.75
DA Warner 77 (56)Daredevils Royals Delhi 99
LJ Wright 34 (10)Warriors Kings XI Mohali 98.6
SPD Smith 39* (16)Warriors Super Kings Chennai 95.06
EJG Morgan 47 (21)KKR Sunrisers Kolkata 94

There's a significant distance between Gayle and the next best innings.

Another way to look at it is to look at what percentage of Gayle's index each innings got. Here's the top 10:

NameScoreGayle points
CH Gayle 175* (66)100
V Kohli 93* (47)40
SR Watson 101 (61)34
V Sehwag 95* (57)34
DA Miller 80* (41)34
CH Gayle 92* (58)31
KD Karthik 86 (48)31
CH Gayle 85* (50)31
MEK Hussey 88 (51)31
MEK Hussey 86* (54)30

How about how it stacks up against all T20 innings anywhere:

NameScoreForAgainstAtIndex
CH Gayle 175* (66)RCB Warriors Bangalore 464.02
LP van der Westhuizen 145 (50)Namibia Kenya Windhoek 406
GR Napier 152* (58)Essex Sussex Chelmsford 398.34
BB McCullum 158* (73)KKR RCB Bangalore 341.97
CL White 141* (70)Somerset Worcs Worcester 284.01
A Symonds 112 (43)Kent Middlesex Maidstone 278.7
M Vijay 127 (56)Super Kings Royals Chennai 276.68
ST Jayasuriya 114* (48)Mum Indians Super Kings Mumbai 270.75
SB Styris 100* (37)Sussex Gloucs Hove 270.27
RE Levi 117* (51)South Africa New Zealand Hamilton 268.41
CG Williams 116 (48)Namibia Scotland Windhoek 268.25
CH Gayle 128* (62)RCB Daredevils Delhi 264.26
DA Warner 135* (69)NSW Super Kings Chennai 264.13
H Davids 112* (48)Cape Cobras Warriors Cape Town 261.33
KJ O'Brien 119 (52)Gloucs Middlesex Uxbridge 260.88
Ahmed Shehzad 113* (49)Barisal Rajshahi Dhaka 260.59
A Symonds 117* (53)Chargers Royals Hyderabad (Deccan) 258.28
YK Pathan 100 (37)Royals Mum Indians Mumbai (BS) 256.76
CL White 116* (53)Somerset Gloucs Taunton 253.89
AC Gilchrist 109* (47)Chargers Mum Indians Mumbai 252.79

And then the "Gayle Points" for the top 20 innings of all time:

NameScoreGayle points
CH Gayle 175* (66)100
LP van der Westhuizen 145 (50)87
GR Napier 152* (58)86
BB McCullum 158* (73)74
CL White 141* (70)61
A Symonds 112 (43)60
M Vijay 127 (56)60
ST Jayasuriya 114* (48)58
SB Styris 100* (37)58
RE Levi 117* (51)58
CG Williams 116 (48)58
CH Gayle 128* (62)57
DA Warner 135* (69)57
H Davids 112* (48)56
KJ O'Brien 119 (52)56
Ahmed Shehzad 113* (49)56
A Symonds 117* (53)56
YK Pathan 100 (37)55
CL White 116* (53)55
AC Gilchrist 109* (47)54

How good was Gayle's innings? It was about 14% better than the next best innings ever. That's how good it was.

Monday, 31 December 2012

2012 Activity rates

A batsman's activity rate is the runs scored per delivery not hit to the fence.

For example two batsmen have 10 off 10. One has hit two 4's, two singles and faced out 6 dot balls. He would have an activity rate of 0.25 because he hit 2 runs off the 8 balls that he didn't hit a boundary off. The second batsman hit one 4, two 2's and two singles. He would have an activity rate of 0.67 because he hit 6 runs off 9 balls that didn't go to the fence.

Here are the batsmen with the highest activity rates:

Test Matches (min 100 balls faced, average of 20)

PlayerMatchesBoundry RunsRun RunsActivity Rate
NLTC Perera (SL) 254560.434
MG Johnson (Aus) 228740.416
Shakib Al Hasan (Ban) 21041010.391
V Sehwag (India) 93221830.368
MA Starc (Aus) 488560.364
RJ Harris (Aus) 446830.362
MJ Clarke (Aus) 117928030.361
DA Warner (Aus) 114463420.361
Mahmudullah (Ban) 280890.353
RT Ponting (Aus) 92323680.341

This year the trend is that there are lots of Australians in the list, and particularly a lot of Australia bowlers. Two names that might surprise a lot of people are Warner and Sehwag. Sehwag certainly doesn't have a reputation for speed between the wickets, and does seem rather loathe to try for a 3, but he and Gambhir have made a real effort to step up their quick singles in the last year. It has certainly been shown out in Sehwag's numbers. Likewise Warner has scored almost as many runs by running as by hitting boundaries. His 50 at the MCG was remarkable for both the speed, but also for how well he ran between wickets. His 50 came up in 34 balls, but it only included four 4's and one 6. It meant that he had scored 28 runs off the 29 balls he didn't hit to the fence.

One Day Internationals (min 100 balls faced, average of 20)

PlayerMatchesBoundry RunsRun RunsActivity Rate
AB de Villiers (SA) 132763690.695
Shakib Al Hasan (Ban) 41101270.672
GJ Maxwell (Aus) 460640.66
AD Mathews (SL) 271803540.659
V Kohli (India) 173986280.63
DJ Hussey (Aus) 252644640.629
SK Raina (India) 172042880.623
R Ashwin (India) 1644910.619
EJG Morgan (Eng) 151642000.599
Sarfraz Ahmed (Pak) 824610.598

Last year almost the whole list was made up of spin bowlers (which is unsurprising, given that spin bowlers are generally smarter (and better looking) than most other players). This year the spinners still make their presence felt. Shakib is the only player on the Test and ODI list.

Twenty20 Internationals (min 100 balls faced, average of 15)

PlayerMatchesBoundry RunsRun RunsActivity Rate
AN Kervezee (Neth)4441100.873
LRPL Taylor (NZ)8861000.82
KC Sangakkara (SL)10941030.78
DJ Bravo (WI)101281320.776
JP Duminy (SA)10941430.765
F du Plessis (SA)7102900.763
SK Raina (India)141281290.75
JC Buttler (Eng)1474690.75
AD Hales (Eng)101881550.745
MS Dhoni (India)141321360.743

There was certainly a surprising name at the top of this list. Alex Kervezee was actually the highest averaging batsman in T20 Internationals too. Ross Taylor is also a surprise, as he had previously been someone who tended to score in multiples of 4. Suresh Raina is the only player in the top 10 for both ODI's and T20's.

The Block-Bash players:

At the other end of the spectrum are the players who specialise in blocking the good balls and cashing in on the bad ones. These players don't see a lot of value in singles, and prefer to get their runs in multiples of 4 or 6.

Test Matches (min 100 balls faced, average of 20)

PlayerMatchesBoundry RunsRun RunsActivity Rate
AB Fudadin (WI) 360620.17
F du Plessis (SA) 21781150.171
JL Pattinson (Aus) 472310.173
Mohammad Ayub (Pak) 116310.189
Mushfiqur Rahim (Ban) 266410.19
DR Flynn (NZ) 61741530.199
SR Tendulkar (India) 92201370.199
Taufeeq Umar (Pak) 6164820.2
N Deonarine (WI) 61161020.204
MJ Guptill (NZ) 103062610.208

Suprisingly, Martin Guptill makes this list again this year, despite improving his activity rate by quite a margin. Generally this is a list of batsmen who are not in great form, and with an average in the twenties despite his obvious talent, this is probably a fair reflection. Daniel Flynn is also on the list, but this possibly has more to do with the way that bowlers have often been trying to get him out playing at wide balls, so have been bowling a 7th stump line to him, trying to get him to give in and have a slash at one. It's hard to hit a single off a ball that you really shouldn't be playing at.

One Day Internationals (min 100 balls faced, average of 20)

PlayerMatchesBoundry RunsRun RunsActivity Rate
AB Barath (WI) 260230.256
CH Gayle (WI) 11252930.279
CS Baugh (WI) 534300.297
DM Bravo (WI) 111041130.298
MR Swart (Neth) 260340.306
KJ O'Brien (Ire) 454350.307
Anamul Haque (Ban) 5110850.343
Imran Farhat (Pak) 5104700.348
Mohammad Nabi (Afg) 562670.358
MN Samuels (WI) 172482340.373

There are a lot of West Indians in this list. However, if I could hit the ball like Chris Gayle, I probably wouldn't bother running too much either.

Twenty20 Internationals (min 60 balls faced)

PlayerMatchesBoundry RunsRun RunsActivity Rate
DR Smith (WI)7152470.412
J Charles (WI)11176750.434
C Kieswetter (Eng)11108720.474
Imran Nazir (Pak)9126500.476
CH Gayle (WI)11270980.492
RE Levi (SA)13170660.5
RJ Nicol (NZ)171941210.515
WTS Porterfield (Ire)13148640.516
Mohammad Ashraful (Ban)660580.527
KJ O'Brien (Ire)1378640.533

It turns out that being a West Indian opener means that you are unlikely to be very good at running between wickets. Johnson Charles' numbers are even worse than last year when he had the lowest activity rate of any player. It's just that this year another West Indian has been even lazier than him. Rob Nicol is an interesting name there, because he's generally a very busy player in domestic cricket.

Tuesday, 13 November 2012

Mini-session Analysis Ban WI Dhaka 2012/13

Powell Solid in Defense © WICB Media
Here is the final mini-session analysis for the first test between Bangladesh and West Indies at Shere Bangla National Stadium, Dhaka, Bangladesh.

A mini-session is (normally) half a session, either between the start of the session and the drinks break or the drinks break and the end of the session. Occasionally a long session will have 3 mini-sessions where it will be broken up with 2 drinks breaks.

Mini-SessionScoreWinner
1-1aWest Indies 67/1 off 15West Indies
1-1bWest Indies 40/2 off 14Bangladesh
1-2aWest Indies 59/0 off 16West Indies
1-2bWest Indies 62/0 off 15West Indies
1-3aWest Indies 65/1 off 15West Indies
1-3bWest Indies 68/0 off 15West Indies
2-1aWest Indies 55/0 off 15West Indies
2-1bWest Indies 21/0 off 13Bangladesh
2-2aWest Indies 41/0 off 17West Indies
2-2bWest Indies 49/0 off 9West Indies
2-3aBangladesh 110/2 off 16Bangladesh
2-3bBangladesh 54/1 off 20draw
3-1aBangladesh 33/0 off 15Bangladesh
3-1bBangladesh 55/0 off 14Bangladesh
3-2aBangladesh 55/1 off 13Bangladesh
3-2bBangladesh 42/0 off 12Bangladesh
3-3aBangladesh 48/2 off 20West Indies
3-3bBangladesh 58/0 off 16Bangladesh
4-1aBangladesh 72/2 off 16Bangladesh
4-1bBangladesh 29/2 off 6.3draw
West Indies 8/0 off 4
4-2aWest Indies 51/1 off 13West Indies
4-2bWest Indies 65/0 off 16West Indies
4-3aWest Indies 69/0 off 16West Indies
4-3bWest Indies 51/5 off 15.5Bangladesh
5-1aWest Indies 29/4 off 9.3Bangladesh
5-1bBangladesh 45/2 off 16West Indies
5-2aBangladesh 38/2 off 13West Indies
5-2bBangladesh 46/3 off 13West Indies
5-3aBangladesh 38/3 off 12.3West Indies

Latest update, click here

Tea, Day 1: West Indies lead the mini-session count 3-1

Chris Gayle started off with a bang, hitting the first ball for 6, but departed soon after. The real star of the day for West Indies so far is the much less flashy Nevisian opener, Kieran Powell. Powell has recently left his flashy stroke making behind, and has started to think like a boring but effective opening batsman. The result is that he has started to play in a boring manner, and do it effectively. While his strike rate of 65.7 may not look particularly boring, he has boosted that with an attacking spree just after bringing up his century, and was prepared to let balls go. During this innings he has the patience to play out 5 maidens. If he continues to bat with this discipline he could go on to a really big score.

Final drinks, Day 1: West Indies lead the mini-session count 4-1

Powell was out right at the start of the session, but the master of being "boring but effective", Shiv Chanderpaul didn't let up. He advanced to 88 in his customary fashion. It took him 38 balls to reach double figures, but he has accelerated steadily since then, scoring at a strike rate of just over 70 since then. The game is closer than 4-1 would suggest, but West Indies are certainly in control.

Stumps, Day 1: West Indies lead the mini-session count 5-1

West Indies are looking like they are in form, and ready to go. Bangladesh are going to need to find an extra gear to keep up with them in this game. Chanderpaul has another century. This is number 27. I've been told that conditions in Bangladesh are quite similar to Guyana, so perhaps it should be little surprise that Chanderpaul looks so composed there. What ever the reason, Bangladesh need some early breakthroughs tomorrow to avoid this match turning ugly.

First drinks, Day 2: West Indies lead the mini-session count 6-1

It would be hard not to drop your head at this point if you were Bangladeshi. The one bright spark is that their new spin bowler, Sohag Gazi has been tidy. He's gone for less than 3 an over in his marathon spell of 42 overs. He has averaged about 46 overs per match in his first class career, and bowled more than 50 in each of his last two first class matches, so he's obviously fairly fit. Less exciting is that he was the last to take a wicket, in his 21st over. Since then there has been nothing on offer for the Bangladesh batsmen as the West Indians have applied the pressure.

Middle drinks, Day 2: West Indies lead the mini-session count 7-2

Bangladesh managed to exert some pressure on the West Indians, as an epic battle of wills started to evolve between Chanderpaul and Shakib Al Hassan. Probably the best player on either side, this is what test cricket is all about. It's safe to say that Chanderpaul is winning this battle, but how he goes later on when the conditions are more in favour of the bowlers is another story. In a match like this it is the battles within battles that are the most interesting.

Final drinks, Day 2: West Indies lead the mini-session count 8-3

And Tamim Iqbal decides to have a turn. After a peculiarly timed declaration from Darren Sammy, Tamim and Shahriar Nafees went crazy at the top of the Bangladeshi innings. However this was different from Tamim's usual innings. At drinks he has 67 off 54, which is a very fast scoring rate, but not out of the usual for him. He has been known to score quickly in the past. The difference here is that of the 67 runs, 52 are in boundaries. Generally he gets a lot of his runs by running, and normally only half of his runs come in boundaries. This departure from his usual trend may be due to the fields that Sammy set for the new ball, or it may signal that Tamim feels like he needs to hit his way into form. Either way it's going to be keeping the crowd happy. Perhaps there is a game on here after all.

Stumps, Day 2: West Indies lead the mini-session count 8-3

A fairly quiet last hour. Tamim departed early and then Naeem and Shakib were content to accumulate slowly after that. My formula actually awarded that hour to the West Indies, but Bangladesh will certainly not be upset with 54 runs for 1 wicket so I called it a draw.

First drinks, Day 3: West Indies lead the mini-session count 8-4

A steady start for Bangladesh. They got through the potentially tricky start of the day and have made slow progress without losing a wicket. In some respect the way that they have ground this out is very promising. For too long Bangladesh have found impressive ways to lose. This stickability does them credit.

Lunch, Day 3: West Indies lead the mini-session count 8-5

Bangladesh are starting to impose themselves on the game now. These two batsmen are getting Bangladesh back into the match, in much the same way that Chanderpaul, Ramdin and Powell tried to bat them out of it.

Middle drinks, Day 3: West Indies lead the mini-session count 8-6

With the new ball approaching Bangladesh tried to increase the pace. They batted well, but lost Shakib. It was a risky shot, but a sensible risk. Now they will have to consolidate with the new ball approaching.

Tea, Day 3: West Indies lead the mini-session count 8-7

The momentum continues with the Bangladeshi batsmen. Naeem Islam has his first hundred, and he has batted well for it. Bangladesh have avoided the follow on, and can now look at trying to look for a first innings lead.

Final drinks, Day 3: West Indies lead the mini-session count 9-7

The game seems to be starting to advance quickly. However the match is still not looking likely to have a result unless something spectacular happens.

Stumps, Day 3: West Indies lead the mini-session count 9-8

Another hour where the scoring rate is roughly at a run a minute. It will be great if this pitch starts to disintegrate and there is a contest between bat and ball. At the moment it's a bit one sided. Just under 1000 runs for only 10 wickets.

Stumps, Day 4: West Indies lead the mini-session count 12-10

Five quick wickets, a potential injury to Chanderpaul and the pitch starting to play tricks means that this is game on here. Earlier Kieran Powell became the 56th batsman in the history of test cricket (and 8th West Indian) to score a hundred in each innings. He joins an impressive list: George Headley, Clyde Walcott, Lawrence Rowe, Rohan Kanhai, Gary Sobers, Gordon Greenidge, and Brian Lara being the previous West Indians to have achieved the feat.

This game may well rest on how well the Bangladeshi top order go, because once Narine gets into their tail on this pitch the game may end very quickly.

First drinks, Day 5: West Indies lead the mini-session count 12-11

Bangladesh have taken the ascendency. Sohag Gazi, after being the first bowler to ever be hit for six of the first ball of a match, now has the best figures on debut for Bangladesh. Tino Best got out playing a defensive shot, a mistake that he is unlikely to ever repeat. Now West Indies will need to bowl well to avoid going 1-0 down in the series.

Lunch, Day 5: West Indies lead the mini-session count 13-11

What a cracker of a last day, after a fairly dreary first 4. West Indies and Bangladesh are both mixing up some very good cricket and some awful stuff. West Indies will want to take 4 wickets in the next 2 hours, to give Narine a crack at the tail in the final session.

Middle drinks, Day 5: West Indies lead the mini-session count 14-11

Tino Best is having a good day. He's possibly the most temperamental cricketer who is not from Pakistan. When he is having a good day, he really has a good day. This is not looking good for Bangladesh.

Tea, Day 5: West Indies lead the mini-session count 15-11

After Tino grabbed his 4th, Verasammy Permaul has made his mark on the game on debut, with two big wickets. Mahmudullah is possibly the best number 8 in world cricket, but he has a lot of work to do, if he is to bat with the tail for the last 2 hours.

End of match: West Indies won the mini-session count 16-11

Bangladesh have followed up a score over 400 with a score under 200, like they have every time except 3 that they have scored 400. Tino Best managed to pick up 5 in dismissing them, but the star of the match was easily Kieran Powell.

Thursday, 12 July 2012

Match report 3rd ODI WI v NZ Warner Park, Bassterre, St Kitts

If you had not seen any other matches this series and arrived to watch this one, you would think that New Zealand were such a superior side that there was little chance of West Indies being able to take a game off them.

This was a dominant performance. New Zealand batted better, bowled better and fielded better.

It started with a great innings from Rob Nicol. Daniel Flynn looked like a world class batsman before chopping one on. However West Indies managed to pick up wickets at regular intervals throughout the innings, but most of them were from short balls that the New Zealand batsmen mistimed. Sammy, Narine and Sammy managed to create some pressure on the New Zealand batsmen. Sammy in particular looked outstanding.

He gave some clues as to how he thought the pitch was playing by moving Chris Gayle into a short straight mid on during the powerplay, banking on New Zealand struggling to time the ball. After the game Williamson noted that the pitch was slower than they had expected, but he felt that it was a good cricket wicket, that gave a chance for both batsmen and bowlers.

New Zealand's innings stalled after the 22nd over, and it took until the 33rd before they managed to get some momentum, but they rode the tempo change well and recovered from 141/5 off 34 to get to what looked like a modest total of 249/9. However sometimes it is difficult to know how good a score is until both teams have batted.

The first over from Kyle Mills went for two boundaries, but the big story was the next over. Trent Boult was given the ball ahead of Tim Southee, with the wind coming over his left shoulder. Normally this end would be given to the senior bowler in the team, but Williamson got the decision completely correct in this match. Southee generally bowls outswing, and while having the wind at his back would help his pace, Boult looked quicker in practice in Jamaica. Mills is the ideal bowler to bowl into that sort of wind. It assists his shape away from the right-hander and also helps the ball sit up a bit more.

Boult's first over got Gayle to defend 4 balls, avoid a quick bouncer and then edge one just between first slip (who was probably too wide) and the keeper. It was a promising start. More was to come in his next over as he picked up the dangerous Johnson Charles; lbw to a perfect inswinging yorker.

Gayle seemed to be struggling with the pace of Boult, so Williamson brought on Southee to give him some quick bowling at the body from both ends. The plan worked. Gayle edged Southee to Nicol, and all of a sudden 250 looked a long way away for the West Indies.

4 overs later it was 52/4 and the game was firmly in New Zealand's favour. 2 more overs and Guptill produced some brilliance to run out Samuels, and West Indies were staggering at 62/5. New Zealand immediately took the bowling powerplay. The 5 overs with the field up cost a total of 9 runs. New Zealand had rediscovered their fielding prowess.

Darren Sammy showed that it was a good pitch to be a tall medium pacer on. Jacob Oram is also a tall medium pacer and it was equally good for him, taking 2/22.

Some rearguard tail-end hitting from Andre Russell almost provided some respectability for the West Indies, but they still lost by 88 runs. Russell's 43* off 24 balls was the only score over 20.

The man of the match was a difficult decision for this match. Nicol top-scored with 59, Nathan McCullum lead the recovery with 50 as well as taking 2 wickets, 2 catches and being involved in a run out, and Andre Russell took 4 wickets to go with his runs. The award went to Nicol, but it was a game with at least 3 outstanding performances. (Southee and Boult both bowled sensationally, without getting the same reward)

West Indies have now lost 4 of the 5 matches they have played at this ground. They will need a significant improvement to improve that record in matches 4 or 5.

Tuesday, 10 July 2012

Why don't we like Kyle Mills

Kyle Mills is an enigma. He doesn't bowl very fast. He swings the ball, but not as much as many other bowlers. He gets a bit of bounce, but he doesn't hit the deck particularly hard. He bowls good line and length, but isn't as metronomic as some other bowlers. And yet he continues to record amazing numbers.

Over the last 7 years he has consistently been a quality bowler. He managed to get ranked as high as number 1 in the world in the ICC ODI bowlers rankings. (He is one of only 5 New Zealanders I can find to have done it, joining Hadlee, Bond, Vettori & Chatfield). His worst year in the last 7 was 2010 when he took 19 wickets in 13 matches at an average of 26.57 and an economy rate of 5.39. This gave him a bowling index score of 23.87. To put that in context Zaheer Khan has a career average of 29.03 and an economy rate of 4.91, (index 23.76). In Mills' worst year he was still as good as Zaheer Khan.

And yet we don't really like him. Nobody calls up talkback praising him. Nobody writes previews of series where he is seen as a threat. He just goes about his work, getting wickets, bowling dot balls, and not being noticed.

I heard through twitter that people had been calling talkback asking for Mills to be dropped. They called up and talked about the time he got hit for 3 sixes and a 4 in an over by Mark Boucher and Jacques Kallis in 2003/4. They never mention that New Zealand won that game, and that was mostly because in the over before going for all the runs, Mills had bowled an almost perfect over to concede just 3 off the bat when they needed 40 off 3. Nor do they mention that this was right at the start of his career, and that he learned a lot from the experience.

After the first two ODI's in Jamaica, I read a couple of newspaper reports that said that Tim Southee was New Zealand's best bowler. I understand that the two reporters were not actually at the ground, so they may not have had the best perspective, but I fail to see how anyone who watched those games can believe that Southee was a better performer than Mills.

Southee had reasonable figures, but that was in part because New Zealand seemed to have a plan to make sure they kept Gayle at Mills' end. Roughly half the deliveries that Mills has bowled this series have been to Gayle. But he has coped with this task well. Here are the figures for all NZ bowlers to Chris Gayle:

Player DeliveriesRunsWicketsE/R
KD Mills 503814.56
NL McCullum 354016.86
TS Nethula 304008.00
TG Southee 415608.20
RJ Nicol 242606.50
JDP Oram 314208.13
DR Flynn 47010.50
RM Hira 916010.67
AM Ellis 7907.71
KS Williamson 4609.00
DAJ Bracewell 2050015.00

And all New Zealand bowlers against everyone else:

Player DeliveriesRunsWicketsE/R
KD Mills 644414.13
MJ Guptill 2206.00
NL McCullum 434416.14
TS Nethula 545315.89
TG Southee 10911446.28
RJ Nicol 304318.60
JDP Oram 718907.52
DR Flynn 2206.00
RM Hira 5607.20
AM Ellis 1731010.94
KS Williamson 1223111.50
DAJ Bracewell 2240210.91

For these tables I've combined the T20's and the ODI's.

I think it is fairly clear who has been the most effective bowler.

Watching the second game live, the battle between Gayle and Mills was fantastic. Mills missed with 3 deliveries and all of them disappeared for 6. The other 30 deliveries that Mills bowled to Gayle in that match conceded just 16 runs.

If New Zealand manage to dismiss Gayle early, Mills will be able to be used at other batsmen. He may well be the trigger that turns the tide in this series. But even if he is, he's unlikely to be celebrated back home.

Sunday, 8 July 2012

Match report 2nd ODI WI v NZ Kingston

Chris Gayle is too good at the moment.

The rest of the West Indian players scored 180 off 193 (incl extras), roughly 5 and a half an over. New Zealand scored 260 off 47 overs, roughly 5 and a half an over. And yet this match was not even close. Gayle is just too good.

The match had the usual ebbs and flows, but throughout it West Indies were better in almost every area.

It started with New Zealand keeping the West Indies under some control for the first 4 overs. West Indies were 1/10, and it was looking like the decision to bowl first was a good one. Then Gayle hit 3 sixes off Kyle Mills.

Despite New Zealand's fielding and bowling being a lot sharper than in previous games, the score kept climbing. For a large section of the game they were looking like they were going to get more than 350. At the other end first Dwayne Smith then Marlon Samuels kept the pressure on the New Zealand attack, occasionally scoring with big shots, but feeding Gayle the strike well.

Gayle seemed to make a special effort to attack Mills and that was probably the best battle of the match. Mills got his man eventually, but he had conceded 34 runs off the 33 deliveries that he bowled to Gayle. The other key battle was Samuels against Nethula. Nethula made life difficult for Samuels, who looked eager to get on top of his fellow spinner. Nethula held Samuels to 19 off 26 deliveries.

West Indies looked all set to explode on 227 off 37, but the New Zealand bowlers stepped up at the death. West Indies only scored 66 off the last 10 overs, a good effort on a 220 pitch, but they really should have been looking for 40 more. Not that it mattered. In the last 6 overs the New Zealand bowlers hit their lengths very well and the West Indian batsmen managed only 3 boundaries.

The New Zealand innings started off well again, having the highest opening partnership for the 4th consecutive match. But Guptill managed to keep picking out fielders. The defining feature of his play in the New Zealand summer was how straight he hit the ball. Often mid on and mid off had to stand so close together that they left gaps in the covers and at mid wicket for him to work singles. Today he managed to hit the ball directly to mid on or mid off a number of times. Part of this may have been due to the West Indian bowling plan.

One of the advantages of playing at home is that you know how a pitch is going to behave, and consequently what length is the hardest to score off. The West Indian bowlers (particularly their spinners and Sammy) bowled a shorter length than the New Zealanders. Chatting to Marlon Samuels after the match he said that that was a deliberate plan, because the pitch tended to hold up as the day went on. Perhaps the difficulty in timing the ball was in part due to this.

The major highlight of the New Zealand innings was BJ Wattling. On Thursday he looked scratchy and out of form. It was almost like he scored the runs more by good luck than good management. Today however he looked classy. It was as though his fifty in the first game convinced him that he could play at this level, and he went out today believing it. His 72* off 62 was as good an innings as you are likely to see, and was a surprise to me, because I have never seen him display that level of ability.

For a brief moment it even looked like Wattling and Oram might take New Zealand home. But 316 was always too much, and it proved to be so.

Today was the West Indies day, and Chris Gayle and Marlon Samuels' day in particular.

Friday, 6 July 2012

Ryder v Watson, part 2

Overnight Jamaica time an epic sporting mismatch took place. Jesse Ryder demolished Mark Watson in a boxing match. Ryder was comprehensively better, and Watson really had very little to offer against Ryder’s power, precision and skill. A few hours a sporting mismatch of a similar magnitude took place at Sabina Park, this time with New Zealand playing the part of Mark Watson and West Indies taking on Jesse Ryder’s role.

Andre Russell celebrated being given one of the new balls by producing a demanding display of swing bowling that asked questions that Guptill, Flynn and Nicol were unable to answer.

Williamson looked like someone who was batting while thinking about other things. He is normally so clinical with his placement, and while he showed some nice touches, he managed to hit the fielders more than the gaps. At one point Sammy created a large gap for him at mid-wicket off Bravo, and almost had him the next ball, as Williamson got a leading edge while trying to hit a ball that was on off stump through that gap. It was field setting par excellence, something Sammy has not yet developed a reputation for. Finally Williamson fell for 24 with the score on 71.

At the other end, putting the batsmen under his spell was Sunil Narine. Watling didn’t get out to him, but never really looked comfortable. Brownlie, however was completely bamboozled, and his lbw looked as much a mercy killing as a wicket.

The New Zealanders recovered from there to post a moderate total, with two good partnerships between Wattling and Ellis and Wattling and Oram. But it felt like too little too late.

The brief New Zealand revival continued into the first few overs of the West Indian innings. The first two overs were maidens (although there were some leg byes scored) and after 3 overs, West Indies were 6 for 1. Mills bowled an outstanding spell to end with the figures of 5 – 1 – 7 – 1. But as well as Mills bowled, it is difficult to win a game by yourself if you are only given 5 overs. After the match I asked Kane Williamson why he didn’t bring Mills back at the end. He replied that he had planned to, but the match was taken away before he got a chance. Perhaps he needed to make that call earlier.

From the end of Mills’ spell it was a Jamaican benefit, with Gayle rearranging the furniture in the ground with frequent big sixes. Smith looked less certain, but kept the strike turning over and occasionally launched a big shot himself.

Tarun Nethula came on to bowl and got one ball to turn quite sharply, and with another deceived Smith with a googly, but dropped the last ball of his second over short to Gayle and disappeared into the third tier of the stadium.

Once the rain came West Indies were in a commanding position of 91/1 off 18 overs. The only thing that could save New Zealand was a washout. The washout never arrived, but instead the match was shortened. The Duckworth-Lewis method is designed to weigh up how strong a position a team is in, and adjust the target accordingly. The system is designed to make sure if a team is in a dominant position before an interruption, that they are in a dominant position after the rain. That was how it played out. West Indies went from needing 100 off 32 overs to needing 43 off 15. Like Ryder after the second standing 8 count, they finished it off with a flurry of big blows. It took only 6.2 overs for them to score the runs.

Just like Mark Watson against Jesse Ryder, New Zealand had no answer against the power, precision and skill of the West Indians.

Monday, 2 July 2012

The Pollard and Gayle innings

Yesterday I got to witness two outstanding innings from Chris Gayle and Kieron Pollard. It made me wonder how they measured up against other innings in T20 internationals this year.

To do this I used a modified batting index score. Batting index is basically the average multiplied by the runs per ball. It is a good measure of how effective a batsman is in limited overs cricket. The problem with using it for single innings is that anyone who gets not out has an infinite score. To counter this I have created a modified index, that I'm going to call innings value. To calculate this there are two options. If the batsman is out, then it is his score multiplied by his score minus 5 divided by the number of balls he faced. For example, if someone got out for 90 off 45 balls his score would be 90 x 85 / 45 or 170. If a batsman gets not out it is his score squared divided by the balls faced. I chose to subtract 5 as when I did an analysis on the cost of wickets each wicket that fell tended to cost a team 5 runs. So if a batsman gets out his team scored 5 runs less (on average).

Here are the top 10 innings this year:

namescoreballsAgainstAtValue
RE Levi (SA) 117* 51v New Zealand Hamilton 268.41
PR Stirling (Ire) 7938v Afghanistan Dubai (DSC) 153.84
MJ Guptill (NZ) 91* 54v Zimbabwe Auckland 153.35
CH Gayle (WI) 85* 52v New Zealand Lauderhill 138.94
KA Pollard (WI) 63* 29v New Zealand Lauderhill 136.86
AD Hales (Eng) 9968v West Indies Nottingham 136.85
BRM Taylor (Zim) 75* 43v New Zealand Hamilton 130.81
PR Stirling (Ire) 61* 32v Canada Dubai (DSC) 116.28
WTS Porterfield (Ire) 56* 27v Kenya Dubai (DSC) 116.15
CA Ingram (SA) 7850v India Johannesburg 113.88

Now there are a few scores in here against 2nd tier nations, but those runs still had to be scored, and so I feel they merit a place in this list. Paul Stirling managed to make the list twice in the tournament in Dubai.

Both of yesterday's innings are in the top 10, and are both ranked about the same as Hales 99 and Taylor's 75*, which feels about right. Both would have been match winning scores in most situations, and coming together in the same match made the West Indies target completely unreachable for New Zealand. It will be interesting to see if there is a repeat dose today.

It also highlights just how good Levi's innings in Hamilton was, in that he scored faster than Pollard, but for almost twice as long.

Saturday, 5 May 2012

Big innings in the IPL


The IPL is a fair way through now, and it's a good time to look back at some of the highlights.

The highest scorers are widely recognised, but often the highest score is not the one that makes the biggest contribution. Take for example the match between Chennai Super Kings and the Deccan Chargers at Vizag. Jadeja hit 48 off 29, a good knock, and one that really set his team up well. When he got out his team looked set for about 175-180, with 2 and a half overs left. Then up steppe Dwayne Bravo. He got to 43 off 18, and carried the team through to 193. It's not that Jadeja did not contribute to the team's total, but despite scoring 5 runs less, Bravo's made a bigger contribution.

I think Cricinfo's S Rajesh came up with the batting index before me (although I developed it independently) as a better way to measure a batsman's performance over a career/season of limited overs cricket than their average. I use that idea (runs squared divided by dismissals and deliveries faced) to look at individual innings. I don't give any bonus for not outs, because I haven't found a way that does that that I feel is fair for individual innings and because the team is effectively all out after 20 overs anyway, so a not out is not as valuable in T20's as it is in the longer forms. So I simply square the runs scored and divide it by the balls faced to find the innings index.

Here is the table of the 25 biggest contributions so far:

NameRunsBallsIndexvsLocationDate
AM Rahane 103* 60176.8v RCB Bangalore 15-4
G Gambhir 9351169.6v RCB Kolkata 28-4
KP Pietersen 103* 64165.8v Chargers Delhi 19-4
V Sehwag 87* 48157.7v Warriors Pune 24-4
AB de Villiers 59* 23151.3v Royals Jaipur 23-4
AM Rahane 9866145.5v Kings XI Jaipur 6-4
V Sehwag 7338140.2v Royals Jaipur 1-5
OA Shah 6026138.5v RCB Bangalore 15-4
OA Shah 7642137.5v Mum Indians Mumbai 11-4
CH Gayle 8148136.7v Warriors Bangalore 17-4
V Sehwag 7339136.6v Mum Indians Delhi 27-4
CH Gayle 8756135.2v Kings XI Mohali 20-4
CL White 7846132.3v Warriors Pune 26-4
CH Gayle 6835132.1v Super Kings Chennai 12-4
JP Duminy 58* 26129.4v Royals Jaipur 17-4
KC Sangakkara 8252129.3v Warriors Cuttack 1-5
JD Ryder 8658127.5v Daredevils Delhi 21-4
CH Gayle 8658127.5v KKR Kolkata 28-4
KA Pollard 6433124.1v Royals Mumbai 11-4
JEC Franklin 7951122.4v Kings XI Mumbai 22-4
CL White 7445121.7v Warriors Cuttack 1-5
CH Gayle 7142120v Kings XI Bangalore 2-5
SE Marsh 68* 40115.6v Mum Indians Mumbai 22-4
DJ Hussey 68* 40115.6v Mum Indians Mohali 25-4
MK Pandey 80* 56114.3v Daredevils Pune 24-4


Some interesting points here:

Chris Gayle makes up 20% of this list. Half of the times he has gone out to bat he has made a big contribution. He is easily the most consistent batsman in the tournament.

Sehwag makes it into the list 3 times and has 2 more innings with an index score of over 100.

There are a few teams that are good at stopping batsmen making big contributions. The best at it is KKR. Only 2 of the top 80 innings were scored against KKR. This is possibly why they have conceded a lot less runs than anyone else.

There are no sub-50 scores on the list, but number 26 on the list is a quite extraordinary innings from Albie Morkel. There are a few interesting innings that didn't make the top 25, here are some of them, including the Bravo and Jadeja innings above:

NameRunsBallsIndexvsLocationDate
JA Morkel 287112v RCB Chennai 12-4
BJ Hodge 48* 21109.7v Chargers Jaipur 17-4
DJ Bravo 43* 18102.7v Chargers Visakhapatnam 7-4
SPD Smith 34* 1388.9v Daredevils Delhi 21-4
RA Jadeja 482979.4v Chargers Visakhapatnam 7-4


I like this method of rating innings, as it gives players at the top and the bottom of the innings an equal chance of producing an innings that count.

Over the next week or so, I'm going to bring out a few different stats from the IPL - let me know if there is anything that you want to know about, and I'll see what I can do.